Since 2014 we have worked on developing a 3D camera-based system to perform 3 major tasks:
- being able to identify the cow while eating
- quantify the amount of feed that the has been eating during a visit
- predict the body weight of the cow
The main aim has been to collect data that can be used for breeding value estimation for feed efficiency so that the bulls we sell semen from have a breeding value with a high accuracy. If this was only based on data from scale based University systems it would be difficult to achieve high accuracies on breeding values for feed efficiency. Also, with data from commercial farms it is possible to document possible improvements in feed efficiency that is achieved in the population. On top of this, an aim has also been to use the collected data for management in the herds where the equipment has been installed.
A clear part of the strategy behind the development has been to have data throughout the lactation as well as across lactations for the cows we measure on. That is essential if one wants to make lifetime analysis as well as having the opportunity to improve feed intake in early lactation where most problems in relation to health occur. Also, the equipment should not disturb the farmer or the cow in their everyday routine and it should not be necessary to handle the cow in any way to get appropriate data out of the system.
We ended up with a system where we have a camera and an ear tag reader at the exit of the milking system that is used in each barn. There we take pictures of the back of the cow (figure 1). These images have three different versions: an RGB version, a 3D version, and an IR version. All images from this gate are stored historically and first and foremost used to identify a cow while eating. They are also used for body weight prediction. Feed intake is quantified in the following way. We can follow the amount of feed lying on the floor in the barn. When a cow enters the feeding table we identify the cow, and we save the last image before the cow puts her head over the feeding table. We also save the time when she started to eat and where in the barn she is standing. When she leaves the spot, we save the time when she left, and we take a new picture of the feed after she takes out her head. We then subtract the surface of the feed before she started eating and the surface after she has finished eating. This quantifies how much she has eaten. These visits can then be summed up to a daily feed intake.
In relation to the body weight, we have earlier installed scales in 4 herds – 1 HOL, 2 JER and 1 RDC herd. We took pictures of the back of the cow and used these images to predict the observed body weight. This had a very high relationship with each other. All these results are further expanded in scientific literature. Calculation of individual cow weight is expected to be a valuable tool in future management.
The data on feed intake and body weight from the CFIT system is now used for the breeding value estimation of feed efficiency in Denmark, Sweden and Finland across Holstein, Jersey and Red dairy cattle. Data is collected on 25 herds (10 HOL, 7 JER and 8 RDC herds) and data is available on more than 13000 cows across the three breeds. Data has been collected routinely since 2017 on the first herd. Installations are still being performed, and the goal is to have data on 10000 cows in all 3 breeds. This should be sufficient to get reliable breeding values for feed efficiency.
The feed intake data can be used for several management decisions. This includes replacement strategies where you replace the most inefficient cows. Also feeding strategies where you follow the way feed is taken away during the day in the specific group. You can follow the amount of residue that is left at the end of each day or perhaps follow effects of fine tuning the diet given to the cows over a longer period. The body weight data can also be used for management decisions. You can follow the body weight change in specific parts of the lactation:
- early lactation mobilisation
- late lactation weight gain
- how the weight change is in the dry period
These metrics all influence performance both in the current lactation but also in the following lactation. Also, you can see when a cow is leaving the mobilization period to change into positive energy balance. First there it makes sense to inseminate the cow if you want the cow to get pregnant. We can also tell how big the heifer is when it gives birth to the first calf in first lactation. This will say something about the farmers’ young stock management without making any registrations in the young stock. All these metrics can be followed on cow level, group level, lactation level and herd level where the farmer can benchmark with other farmers that makes sense to compare to. It is crucial to make the data available in a way that makes the farmer want to use the data. If the quality of the reporting tool is insufficient the data will not be used in a proper way and even though the data will be good value to use, it will still be left unused.
Feed intake is the main driver of methane production. With higher feed intake the methane production increases. So, if farmers use this kind of data to get more efficient cows, this will also have a positive effect on the climate footprint of a litre of milk. Thereby the system is a win-win system, which both helps the farmers’ economy but also has a positive effect in the climate debate.
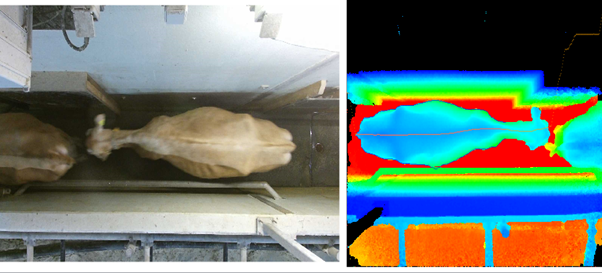
Figure 1: RGB and 3D depth image taken in gate after milking initiated by the reading of the cows eartag
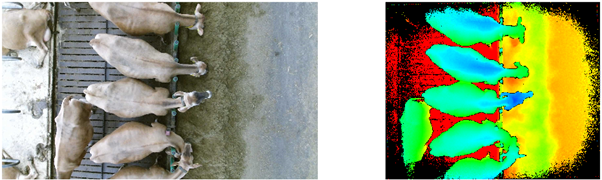
Figure 2. RGB and 3D depth image taken at the feeding table. Images taken in the gate after milking is used to identify the cows while eating